How to setup EFK logging on AWS EKS

How to setup EFK logging on AWS EKS

Introduction
Amazon Elastic Kubernetes Service (AWS EKS) a fully managed Kubernetes service from AWS. When running multiple services and applications on a Kubernetes cluster, a centralized, cluster-level logging stack can help you quickly sort through and analyze the heavy volume of log data produced by your Pods. One popular centralized logging solution is the Elasticsearch, Fluentd, and Kibana (EFK) stack.
Elasticsearch is a real-time, distributed, and scalable search engine which allows for full-text and structured search, as well as analytics. It is commonly used to index and search through large volumes of log data, but can also be used to search many different kinds of documents.
Elasticsearch is commonly deployed alongside Kibana, a powerful data visualization frontend and dashboard for Elasticsearch. Kibana allows you to explore your Elasticsearch log data through a web interface, and build dashboards and queries to quickly answer questions and gain insight into your Kubernetes applications.
In this tutorial we’ll use Fluentd to collect, transform, and ship log data to the Elasticsearch backend. Fluentd is a popular open-source data collector that we’ll set up on our Kubernetes nodes to tail container log files, filter and transform the log data, and deliver it to the Elasticsearch cluster, where it will be indexed and stored.
We’ll begin by configuring and launching a scalable Elasticsearch cluster, and then create the Kibana Kubernetes Service and Deployment. To conclude, we’ll set up Fluentd as a DaemonSet so it runs on every Kubernetes worker node.
Prerequisites
- A Kubernetes 1.10+ cluster with role-based access control (RBAC) enabled
- The
kubectlcommand-line tool installed on your local machine, configured to connect to your cluster. You can read more about installingkubectlin the official documentation. - Access to AWS console.
Steps
- Step 1 - Launch Elasticsearch using AWS Marketplace (Bitnami certified).
- Step 2 - Setup Fluentd as a kubernetes daemonset.
- Step 3 - Deploy Kibana as a kubernetes deployment.
Step 1 - Launch Elasticsearch
This part is of the post is the easiest. All you need to do is to visit AWS Marketplace, search for Bitnami Elasticsearch and then go forward with the launch wizard to choose your custom configs and choices till you launch the Elasticsearch cluster.
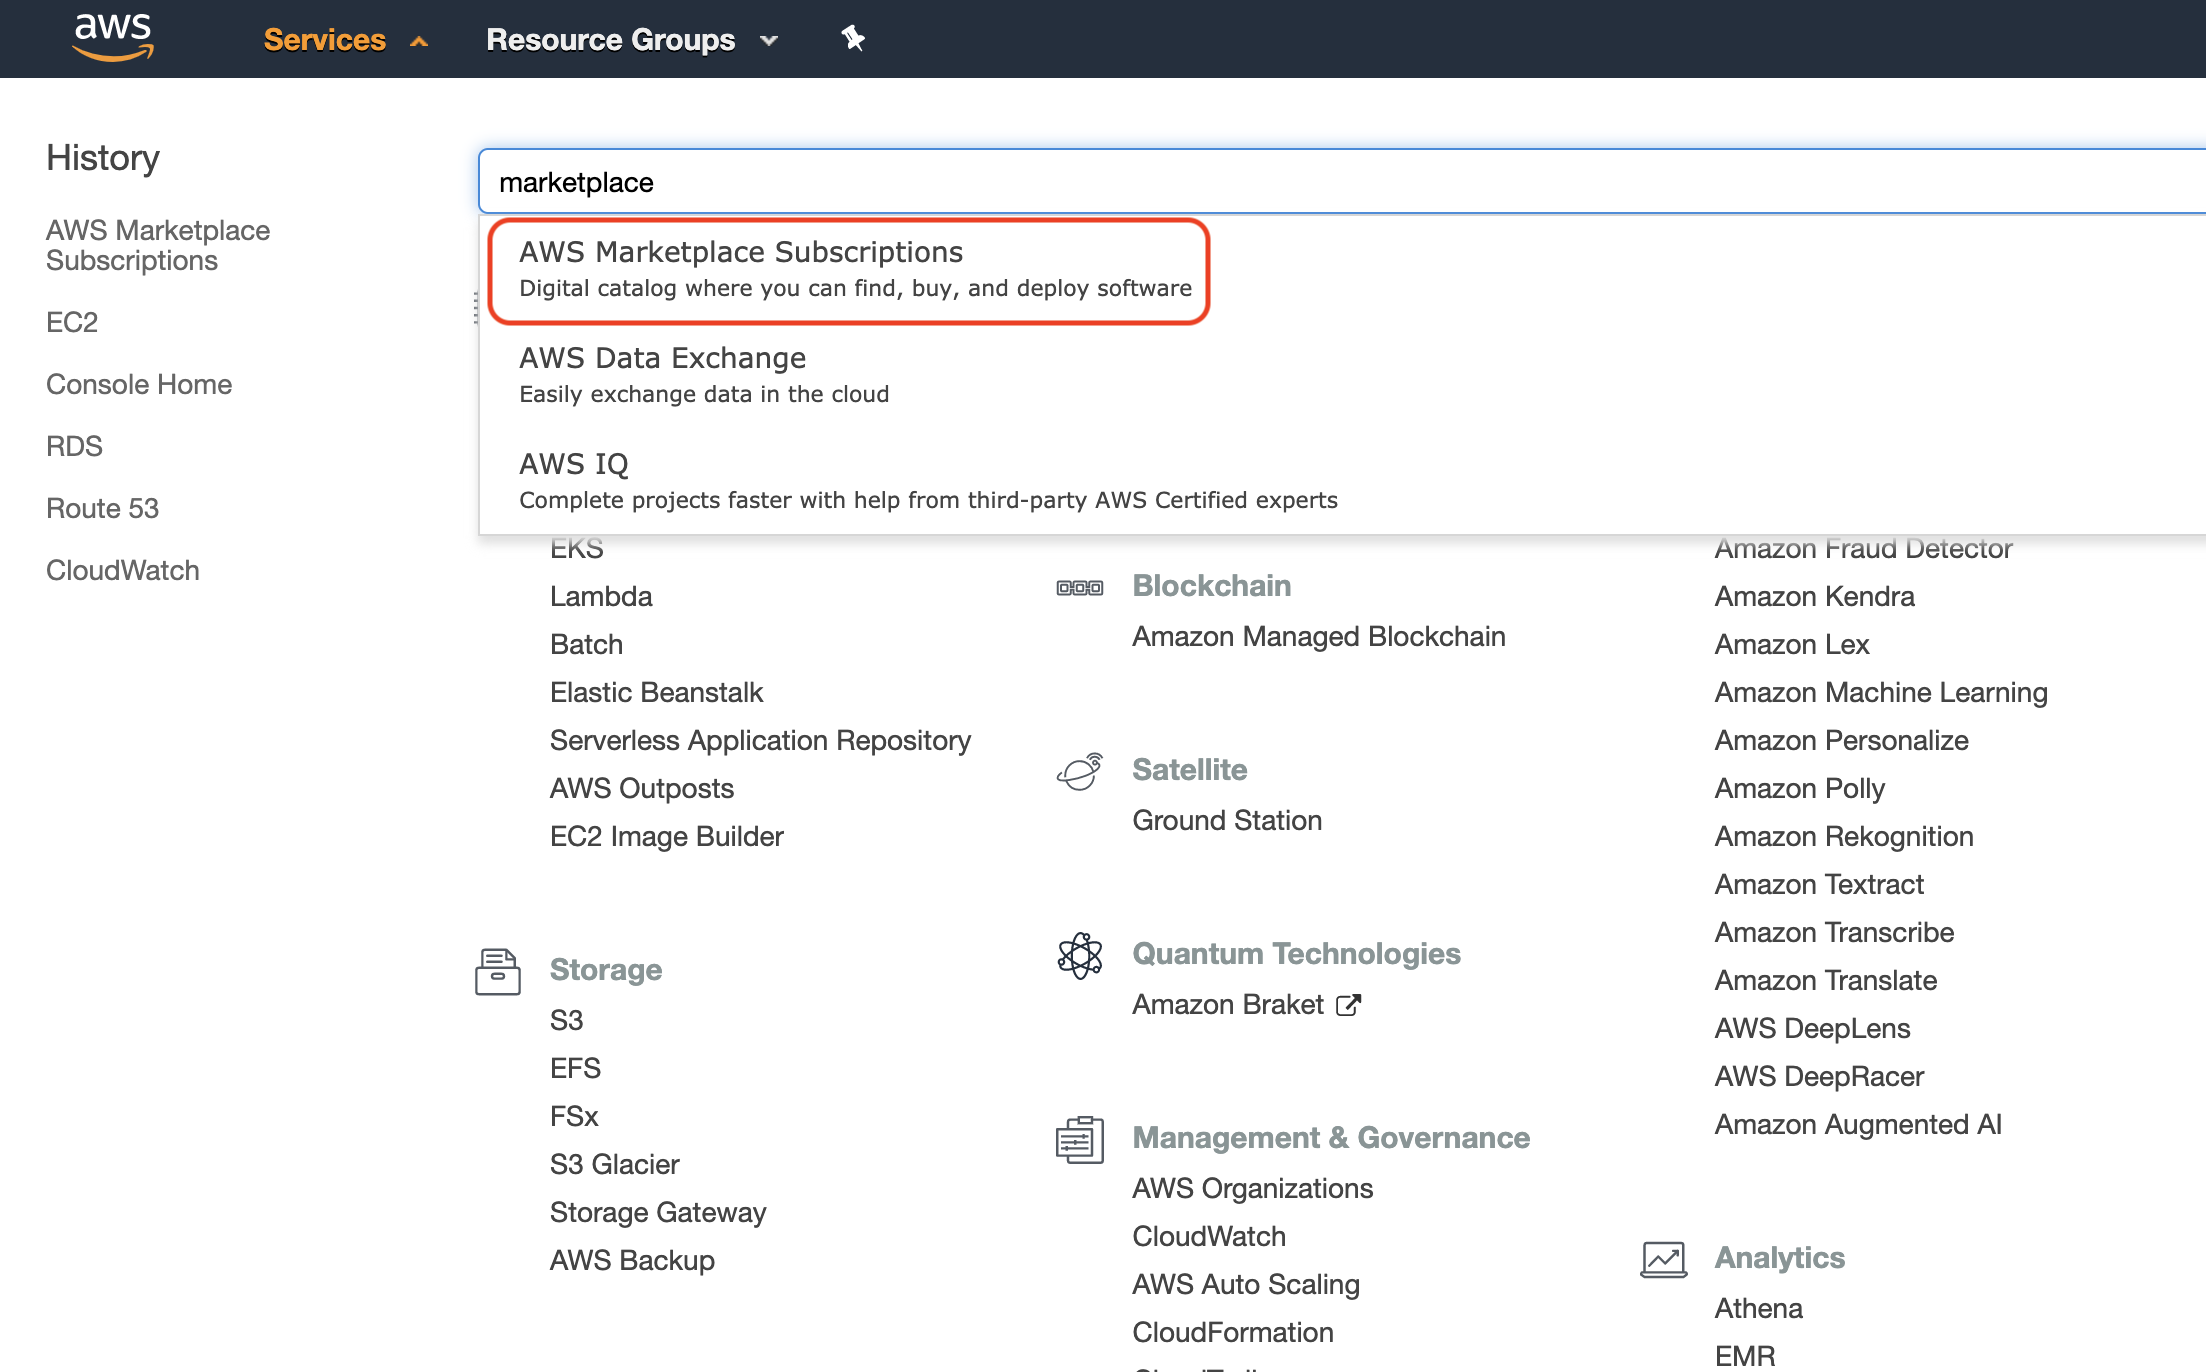
This is a quick and simple visual guidance of how to do this. First go and visit AWS Marketplace from your AWS console as shown here:
Then search for Bitnami Elasticsearch as shown here:
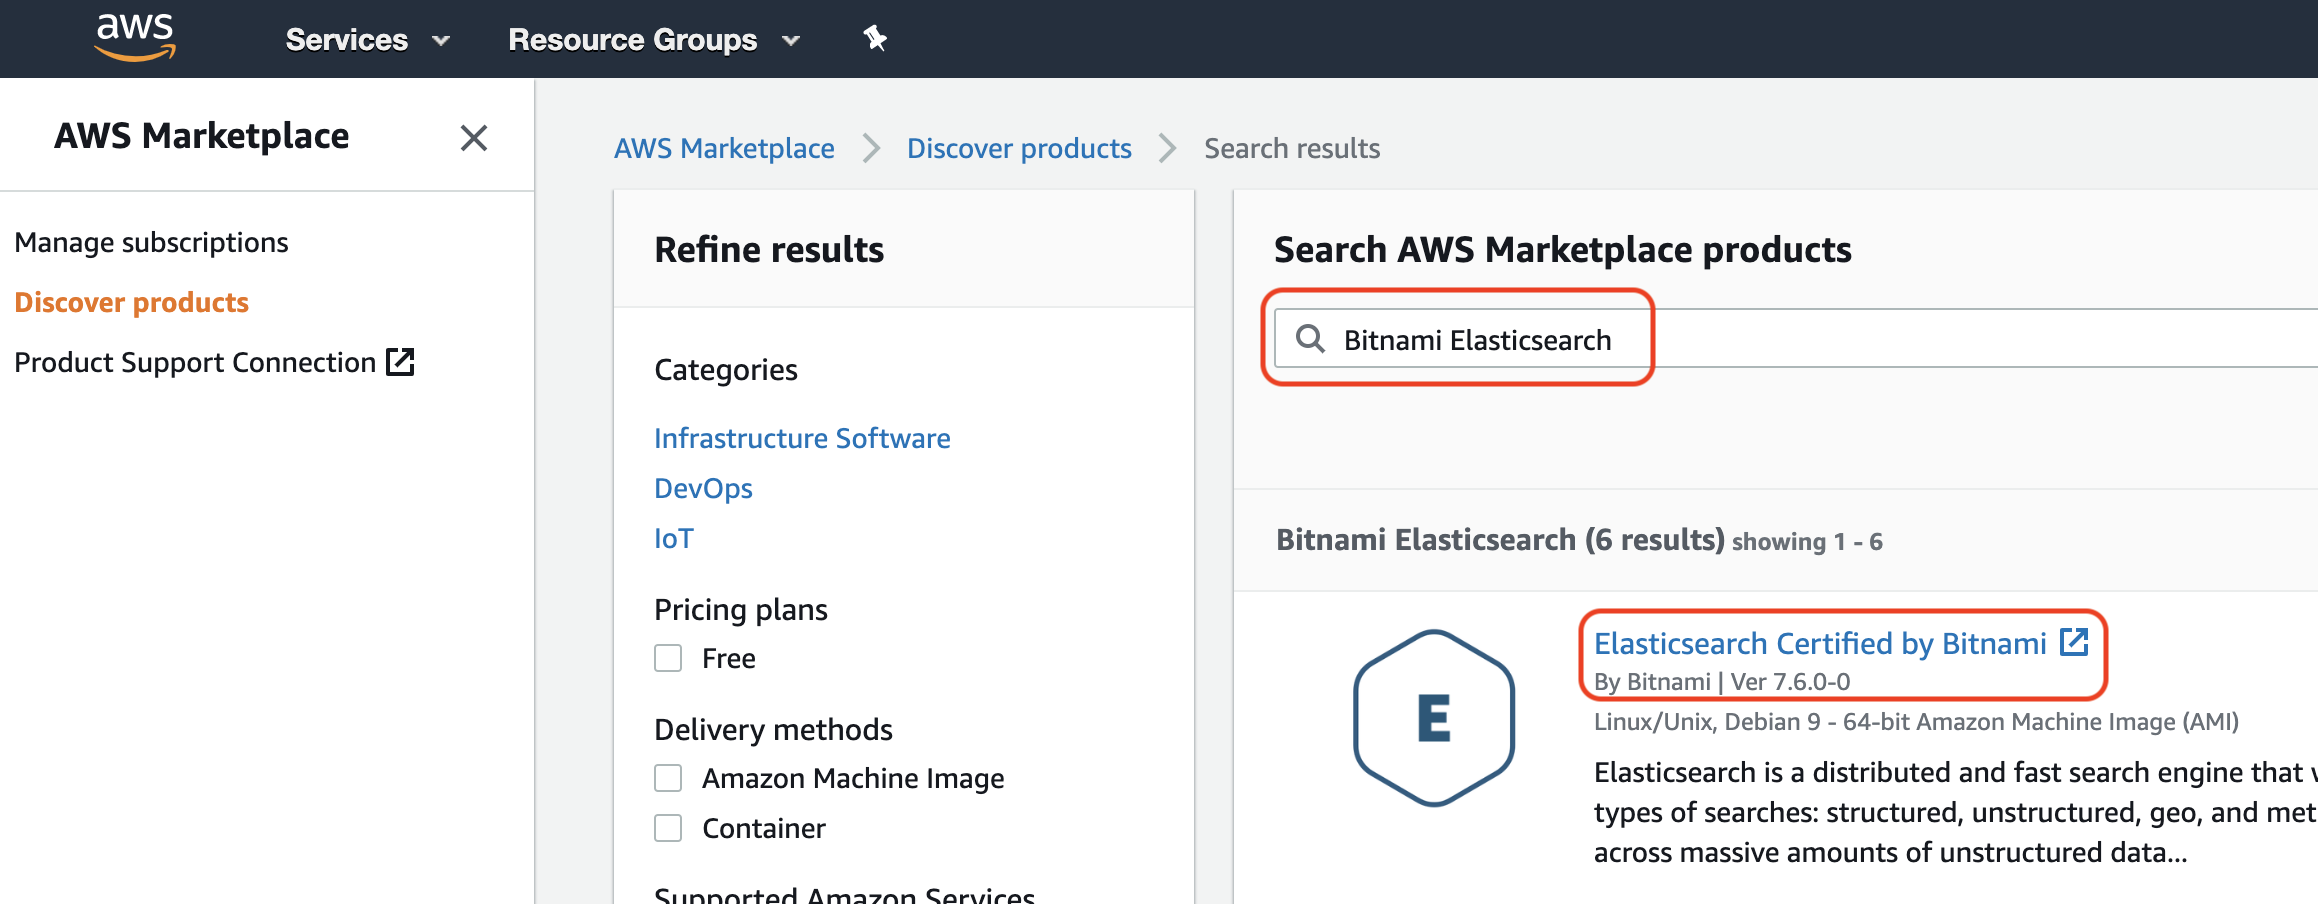
Make sure that you pick the latest available version of Elasticsearch Certified by Bitnami (might be different from what's shown in the picture as this was the latest version available when this post was written).
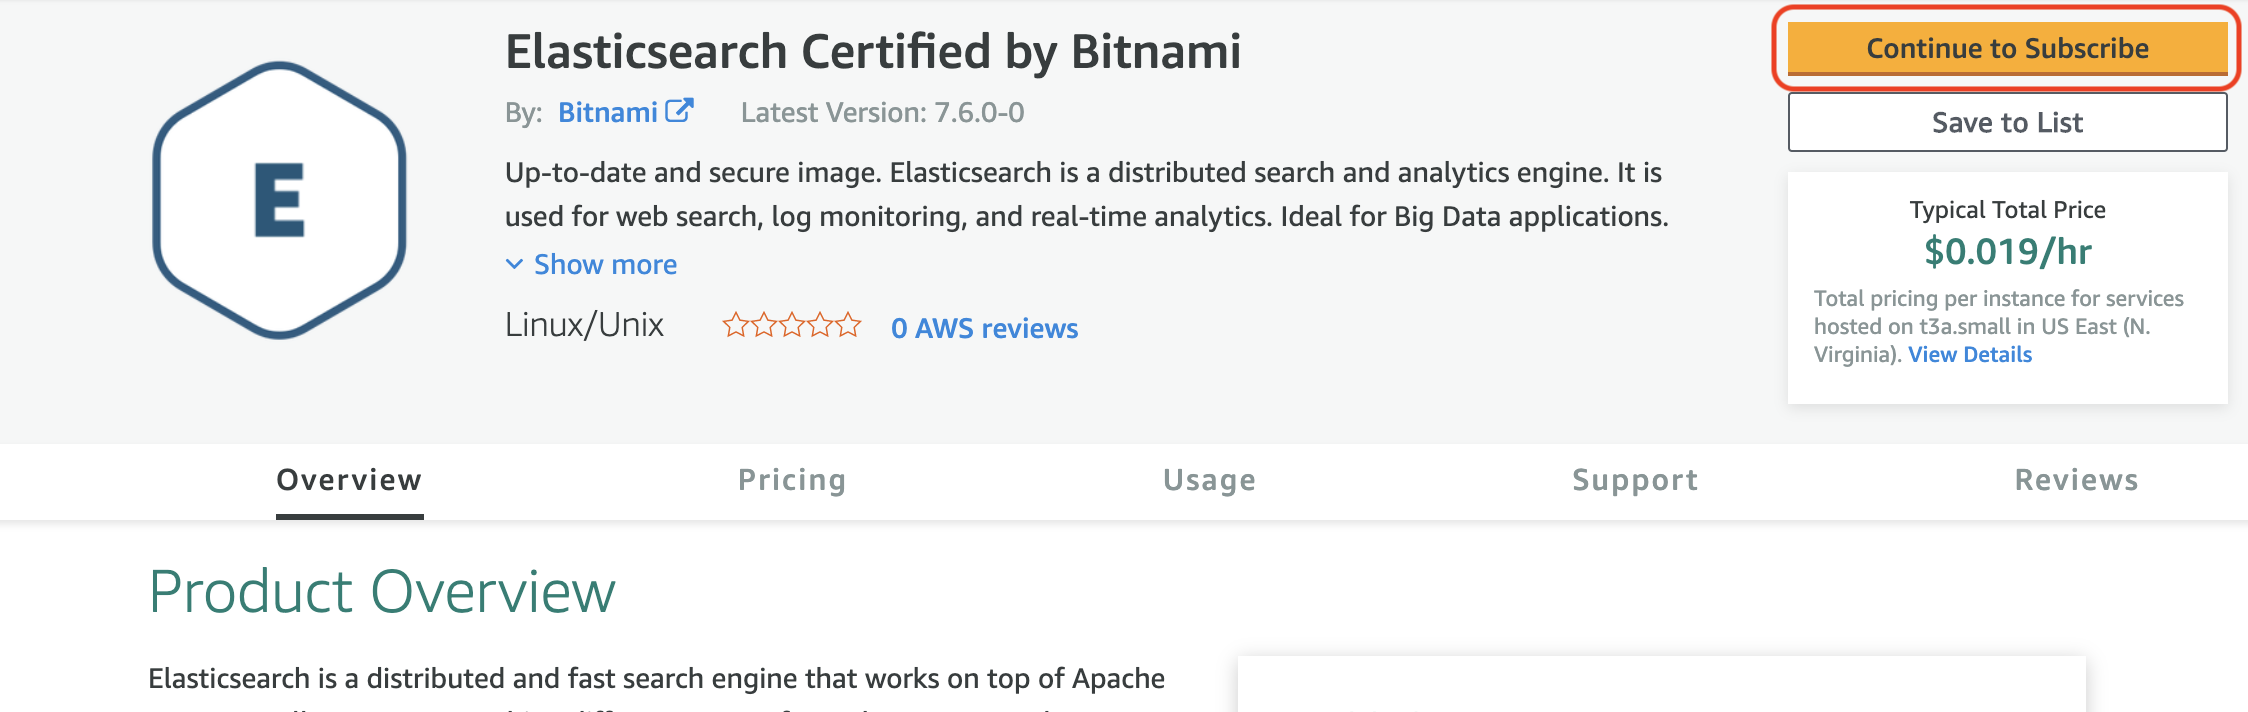
Last step is to click the Continue to Subscribe button shown in the next image which will start a launch wizard. You just need to follow the launch wizard steps and make your choices and configs and it will create the Elasticsearch cluster.
After creating the Elasticsearch cluster, you can try and SSH to one of the cluster nodes and curl localhost (as shown below) to make sure that Elasticsearch is working perfectly and as expected.
bitnami@ip-1.0.3.1:~$ curl -XGET 'localhost:9200/'

{
  "name" : "ip-1.0.3.1",
  "cluster_name" : "bnCluster",
  "cluster_uuid" : "LW7__vmG45a6UT-123g9ilw",
  "version" : {
    "number" : "7.5.1",
    "build_flavor" : "oss",
    "build_type" : "tar",
    "build_hash" : "3ae9ac9a93c95bd0cdc054951cf95d88e1e18d96",
    "build_date" : "2019-12-16T22:57:37.835892Z",
    "build_snapshot" : false,
    "lucene_version" : "8.3.0",
    "minimum_wire_compatibility_version" : "6.8.0",
    "minimum_index_compatibility_version" : "6.0.0-beta1"
  },
  "tagline" : "You Know, for Search"
}Step 2 - Setup Fluentd
In this step we will use Helm to install kiwigrid/fluentd-elasticsearch chart on kubernetes. This chart will deploy a Fluentd daemonset which will basically run a pod on each node in the k8s cluster with all required logs files mounted to the fluentd pod. So Fluentd will be able to collect these metrics and send it to the Elasticsearch cluster which was created in the last step.
First we need to create a fluentd.yaml file which we can use to override some chart values as needed. This fluentd.yaml should look like:
elasticsearch:
  host: 1.0.3.1 # Elasticsearch cluster IP
  port: 9200 # Elasticsearch cluster PORT
schema: httpAssuming that you want to install the daemonset in kube-system namespace and name it as fluentd you can then use the following command:
$ helm install fluentd --namespace kube-system -f fluentd.yaml kiwigrid/fluentd-elasticsearchTo verify that the chart has been deployed successfully. You could use helm list command to get a list of installed charts on specific namespace as follows:
$ helm list --namespace kube-system
NAME   	NAMESPACE  	STATUS    CHART                        APP
fluentd	kube-system	deployed  fluentd-elasticsearch-5.3.2  2.8.0
Also, you could use kubectl get pods command to get a list of the running pods on specific namespace as follows:
$ kubectl get pods -n kube-system | egrep -o "fluentd[a-zA-Z0-9-]+"

fluentd-fluentd-elasticsearch-fsfsk
fluentd-fluentd-elasticsearch-skcnfIn this example, I had a 2 nodes EKS cluster so the daemonset created 2 pods, one for each node to collect logs.
Now, we have Fluentd collecting and forwarding logs to Elasticsearch which is persisting and indexing it. The missing piece is Kibana which will help us to browse, query and visualize the collected and indexed logs. In next step we will see how we can deploy Kibana as a kubernetes deployment and connect it to Elasticsearch.
Step 3 - Deploy Kibana
To deploy Kibana we can use the helm chart (bitnami/kibana) which is created certified and maintained by Bitnami as follows:
$ helm repo add bitnami https://charts.bitnami.com/bitnami
"bitnami" has been added to your repositories

$ helm install my-release --namespace kube-system bitnami/kibana --set elasticsearch.hosts[0]=1.0.3.1 --set elasticsearch.port=9200
NOTE: This chart will use any installed PV provisioner to create a persistent volume and attach it to Kibana's deployment pods to store Kibana configs and avoid losing these configs when pods restarts or die.
To validate that Kibana pod is deployed and running, you could run the following command:
$ kubectl get pods -n kube-system | egrep -o "kibana[a-zA-Z0-9-]+"

kibana-6b7f6bdc85-ls59zor you could list the helm chart deployed to namespace kube-system with:
$ helm list --namespace kube-system
NAME NAMESPACE STATUS CHART APP VERSION
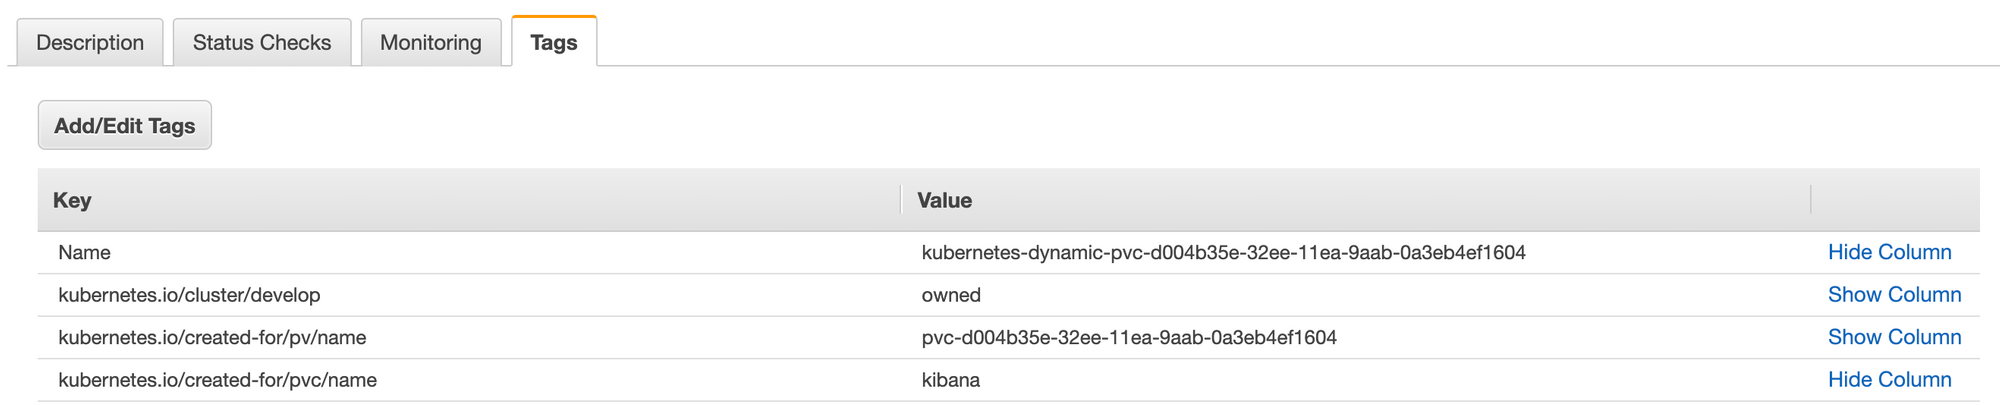
kibana kube-system deployed kibana-5.0.2 7.5.1Also, when you go to: AWS web console -> EC2 -> Elastic Block Store -> Volumes.
You can see the automatically created persistent volume by kubernetes attached to Kibana deployment.
At this point we have deployed the full EFK stack to collect, store, index and observe logs from the EKS cluster. Happy logs searching 🕵️♂️